When to use it
Use canonical visualization tokens and keep the application data model explicit. Provide a concise factual label, and retain the readable native fallback supplied by the component.
Plot numeric scatter and bubble relationships with semantic series tones.
Native example
Use canonical visualization tokens and keep the application data model explicit. Provide a concise factual label, and retain the readable native fallback supplied by the component.
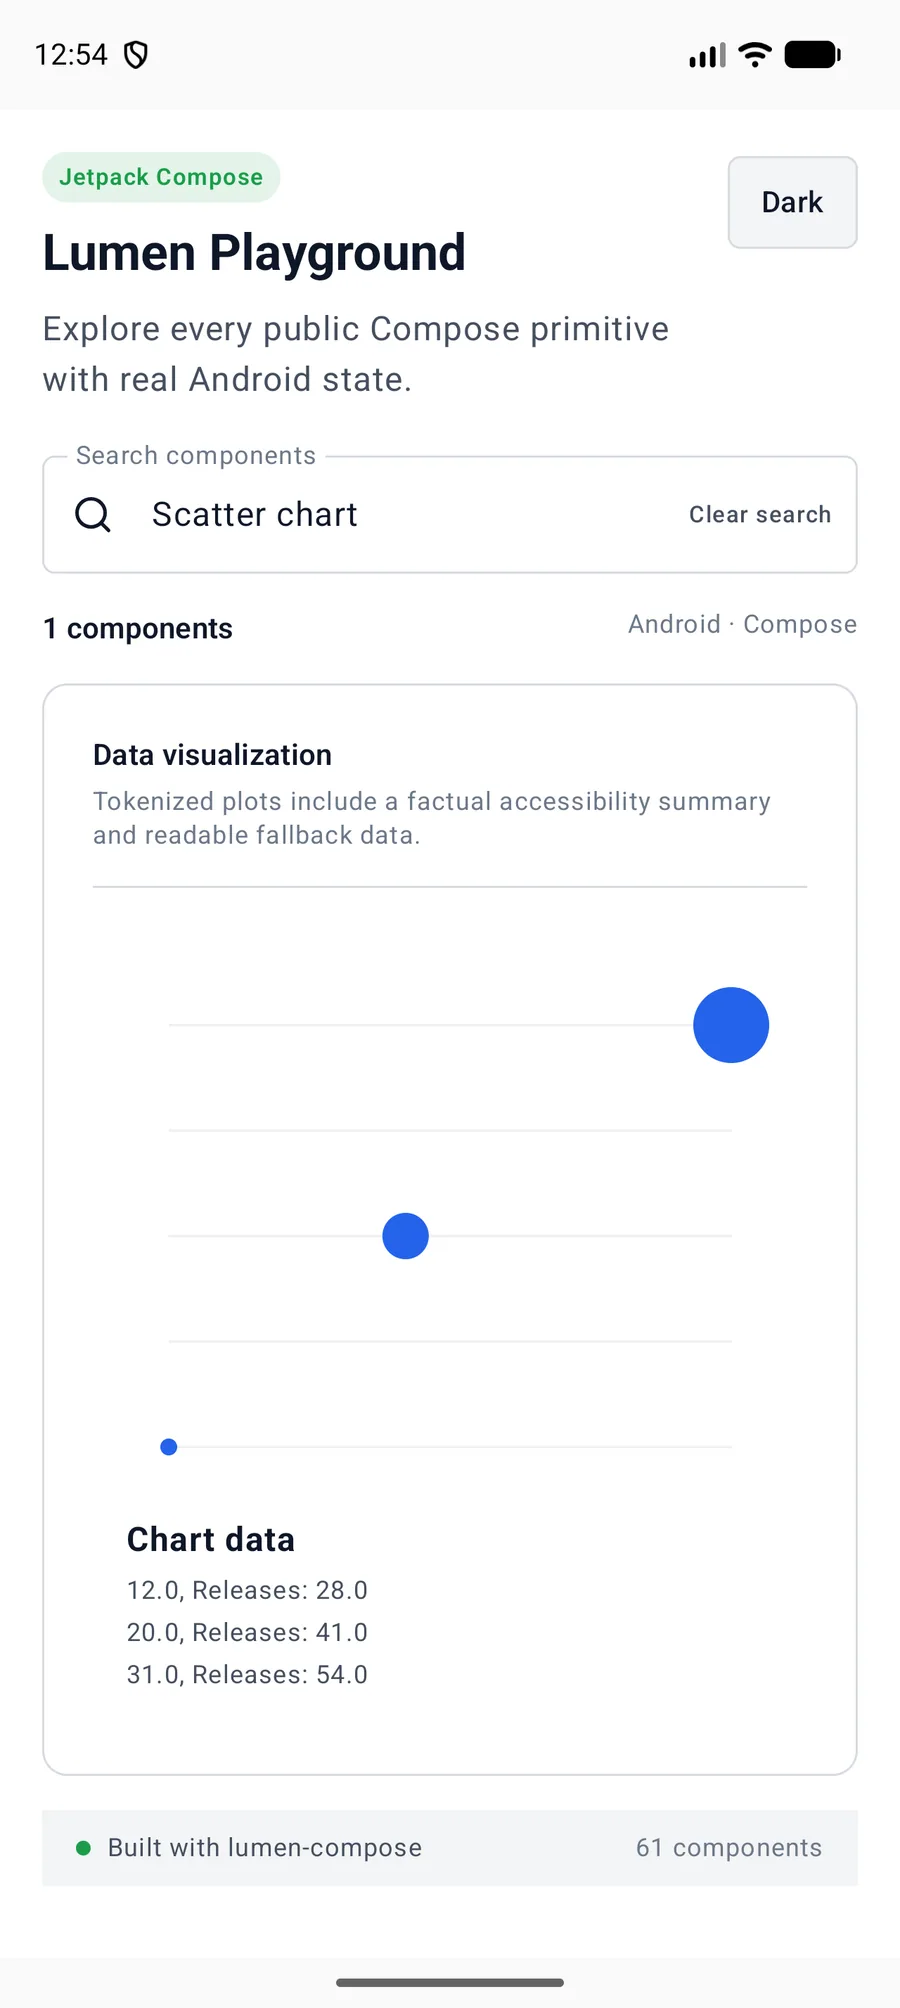
LumenScatterChart(
    series = relationshipSeries,
    label = "Quarterly revenue"
)
Reference
The primary shared and platform-specific options exposed by LumenScatterChart.
| API | Values or type | Default | Description |
|---|---|---|---|
| label | String | Required | Provides the concise accessible name for the visualization. |
| series | Typed native chart data | Required | Supplies finite values and stable identifiers through the shared chart contract. |
Native behavior
Use canonical visualization tokens and keep the application data model explicit. Provide a concise factual label, and retain the readable native fallback supplied by the component.
Provides a factual summary and readable fallback data while decorative marks remain hidden.
Shared component